Meta Forecast in your mailbox - every first Monday of the month.
I read and accept the privacy policy
Premium subscription
Additional data, raw outputs and API.
AFRICA GROWTH
Real time monitor of economic activity in all African countries.
BLOG
Discover what we have been doing and what interested us recently.
Meta Forecast methodology
Philosophy of the Meta Forecast
What is the benefit of combining different forecasts?
The meta-forecast is based on the simple idea that combining several forecasts usually lead to better performance than relying on a single forecasting source, however sophisticated.
This approach is supported by an extensive academic literature, with the main reference works listed at the end of this note. Following a famous seminal article by Bates and Granger (1969), forecast combination became a highly studied research topic. In 1989, Clemen later conducts an comprehensive review of the topic, noting “an explosion on the number of articles on combining forecasts”.
One of the main theoretical reason why forecasts combinaison works so well in many cases is that every forecast contains some useful independent information that is not considered by the other forecasts and that is worth taking into account.
The Meta Forecast empirically demonstrates the value of this approach for GDP forecast, using a variety of sources to produce forecasts with a low forecasting error (the errors are computed in real-time since 2005). The result is a monthly-updated forecast with a very high accuracy and a consistent methodology over time, as no human judgment is involved.
What are the sources used for the forecasts?
- International institutions: we take into account the latest forecasts published by major international institutions such as the IMF, the OECD or the European Central Bank. These forecasts are often seen as a reference for the global economic outlook.
- Professional forecasters: we incorporate forecasts made by private sector forecasters from a variety of organizations.
- Naive forecast: simple univariate models based on quarterly national accounts (univariate autoregressive models, exponential smoothings using only lags of the variable being forecasted).
How do you combine the different sources?
Instead of using a simple average, we are weighting the forecasts based on the historical accuracy of each source in similar conditions (forecasting horizon, pace of GDP growth).
This approach provides several benefits:
- Historically more accurate sources (“better forecasters”) have a larger weight in our final our forecast.
- In particular, the most recent forecasts generally have a larger weight in our final forecast (because they include the most up-to-date information).
- Forecasts are adjusted for their historical bias at the same forecasting horizon and in similar economic conditions.
- The uncertainty surrounding the forecast, measured by prediction intervals, is based on the historical errors of the meta forecast itself, taking into account the forecasting horizon. As a result, the closer we get to the end of the year, the lower will the uncertainty surrounding the forecast be.
What are the advantages of using naive forecasts?
The main argument behind the inclusion of naive forecasting models among our forecasting sources is their very strong performance, reflecting the low average volatility of macroeconomic variables as well their strong inertia, with the very latest point of a given time series containing the highest quantity of information.
Other advantages of naive forecasting model also include:
- Neutralizing bias (no human judgment in the process)
- Reflecting the latest quarterly national accounts publications and revisions (as soon as they are published, even if not reflected in all other sources).
- Preventing over-adjustement of forecasts following recent information.
The forecasting process in practice
Source description
Each month, the meta-forecast is updated based on the latest forecasts and publications from a wide variety of sources, which are all listed in the table below. The sources span the three main forecast categories that are comprised in the meta-forecast: international institutions forecasts, private sector forecasts and naive forecasts.
|
Source |
Type of forecast |
Frequency |
Area covered |
|
IMF –
World Economic Outlook (WEO) |
International institutions |
Quarterly |
United States, Eurozone, China |
|
OECD
– Economic Outlook (EO) |
International
institutions |
Semiannual |
United
States, Eurozone, China |
|
World Bank – Global Economic
Prospects (GEP) |
International institutions |
Semiannual |
United States, Eurozone, China |
|
European
Commission – Economic Forecasts |
International
institutions |
Quarterly
|
Eurozone |
|
European Central Bank –
Macroeconomic projections |
International institutions |
Quarterly |
Eurozone |
|
Asian
Development Bank – Asia Development Outlook (ADO) |
International
institutions |
Quarterly
|
China |
|
Federal Reserve of Philadelphia
– Survey of Professional Forecasters |
Professional Forecasters |
Quarterly |
United States |
|
European
Central Bank – Survey of Professional Forecasters |
Professional
Forecasters |
Quarterly
|
Eurozone |
|
USA Bureau of Economic Analysis
(BEA) – ARIMA on the basis of quarterly national accounts |
Naive Forecast |
Quarterly |
United States |
|
Eurostat – ARIMA on the basis of quarterly national accounts |
Naive
Forecast |
Quarterly |
Eurozone |
|
China’s National Bureau of
Statistics (NBS) – ARIMA on the basis of quarterly national accounts |
Naive Forecast |
Quarterly |
China |
Regarding private sector forecasters, we are relying on the Surveys of Professional Forecasters (SPF) conducted by the Federal Reserve of Philadelphia for the United States and the European Central Bank for the Eurozone to have an overview of the economic forecasts conducted by a wide number of private sector organizations. Both of these surveys include forecasts made by economists from more than 50 private sector organizations in a variety of sectors.
In the case of China, for the sake of transparency, we chose not to include forecasts from professional forecasters in the meta-forecast, because of the absence of an open access dataset aggregating private sector forecasts.
Combining the forecasts
Each month, we combine all of the previously mentioned sources to formulate a forecast for the current year (year N) and the next (year N+1).
When combining the different forecast sources to create the meta-forecast, we assign a weight to each source based on its historical accuracy given the forecasting horizon, using data going back as far as 2005 for each source.
The meta-forecast will be a weighted average of all the sources on the basis of their respective weight. This method ensures that historically accurate forecasting methods have more sway in the final result. In addition, taking into account the forecasting horizon allows us to discount the weight of older forecasts that may not incorporate the newest information. Finally, our weighting will reflect the fact that some methods are more accurate at a very short-term horizon, while others perform relatively better at a medium-term horizon.
Going into more detail, it is worth noting that the weighting process is conducted in two distinct steps, in order to ensure that the three distinct forecast categories that compose the meta-forecast (institutional, professional and naive) hold equal weight (given equivalent accuracy). First, the forecasts from international institutions are compared with one another in terms of accuracy to construct a weighted “aggregated institutional forecast”. Second, the accuracy of this aggregated institutional forecast is compared with the forecast from the two other categories (professional forecasters and naive forecast) to construct the meta-forecast.
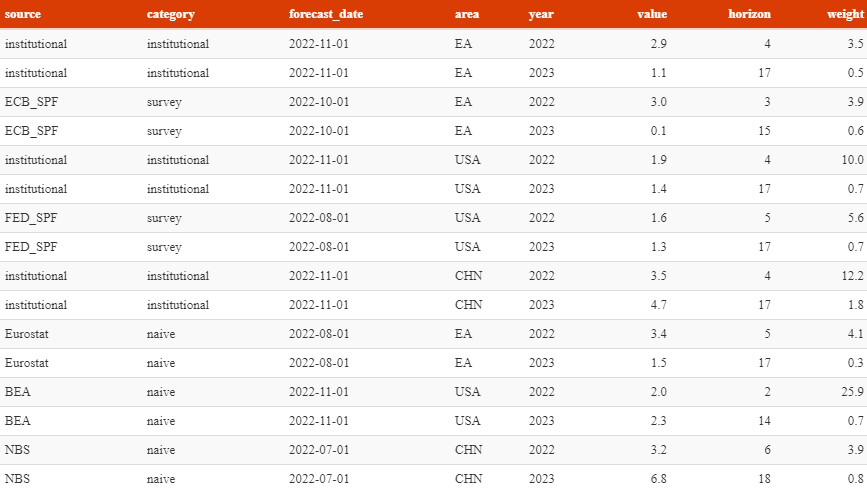
The weights are computed in real time and readjusted for each monthly publication on the basis of all available information. As an example, a table featuring the weight coefficients used in a recent meta-forecast is featured below.
As the final step of the combination, we compute the historical bias for the meta-forecast and correct the final forecast to achieve a bias-free forecast.
Practical example of weighting: In any given year, the December vintage of our meta-forecast would feature the forecasts from the World Bank’s Global Economic Prospects published in June (hence with a forecasting horizon of 6 months for the year N). This forecast might be relatively outdated, compared to newer forecasts from other sources published later in the year and encompassing more recent information (with a forecasting horizon as low as one month if they are published early in December). This will be reflected in the fact that the historical Mean Absolute Error (MAE) of the World Bank forecasts with a forecasting horizon of 6 months will be substantially higher than that of other more recent sources featuring a lower forecasting horizon. Given the fact that the weight of each source is based on the inverse of the MAE, the World Bank forecast will be heavily discounted compared to other, newer forecast sources and will have a small incidence on the overall meta-forecast.
Forecast uncertainty
Macroeconomic forecasting is very uncertain. Like other forecasts, the meta-forecast will sometimes miss the mark. It is important for us to be fully transparent about the uncertain nature of the forecast we present and about what can be realistically expected in terms of accuracy.
It is also worth noting that the systematic nature of the meta-forecast production makes the quantification of historical errors particularly practical and meaningful.
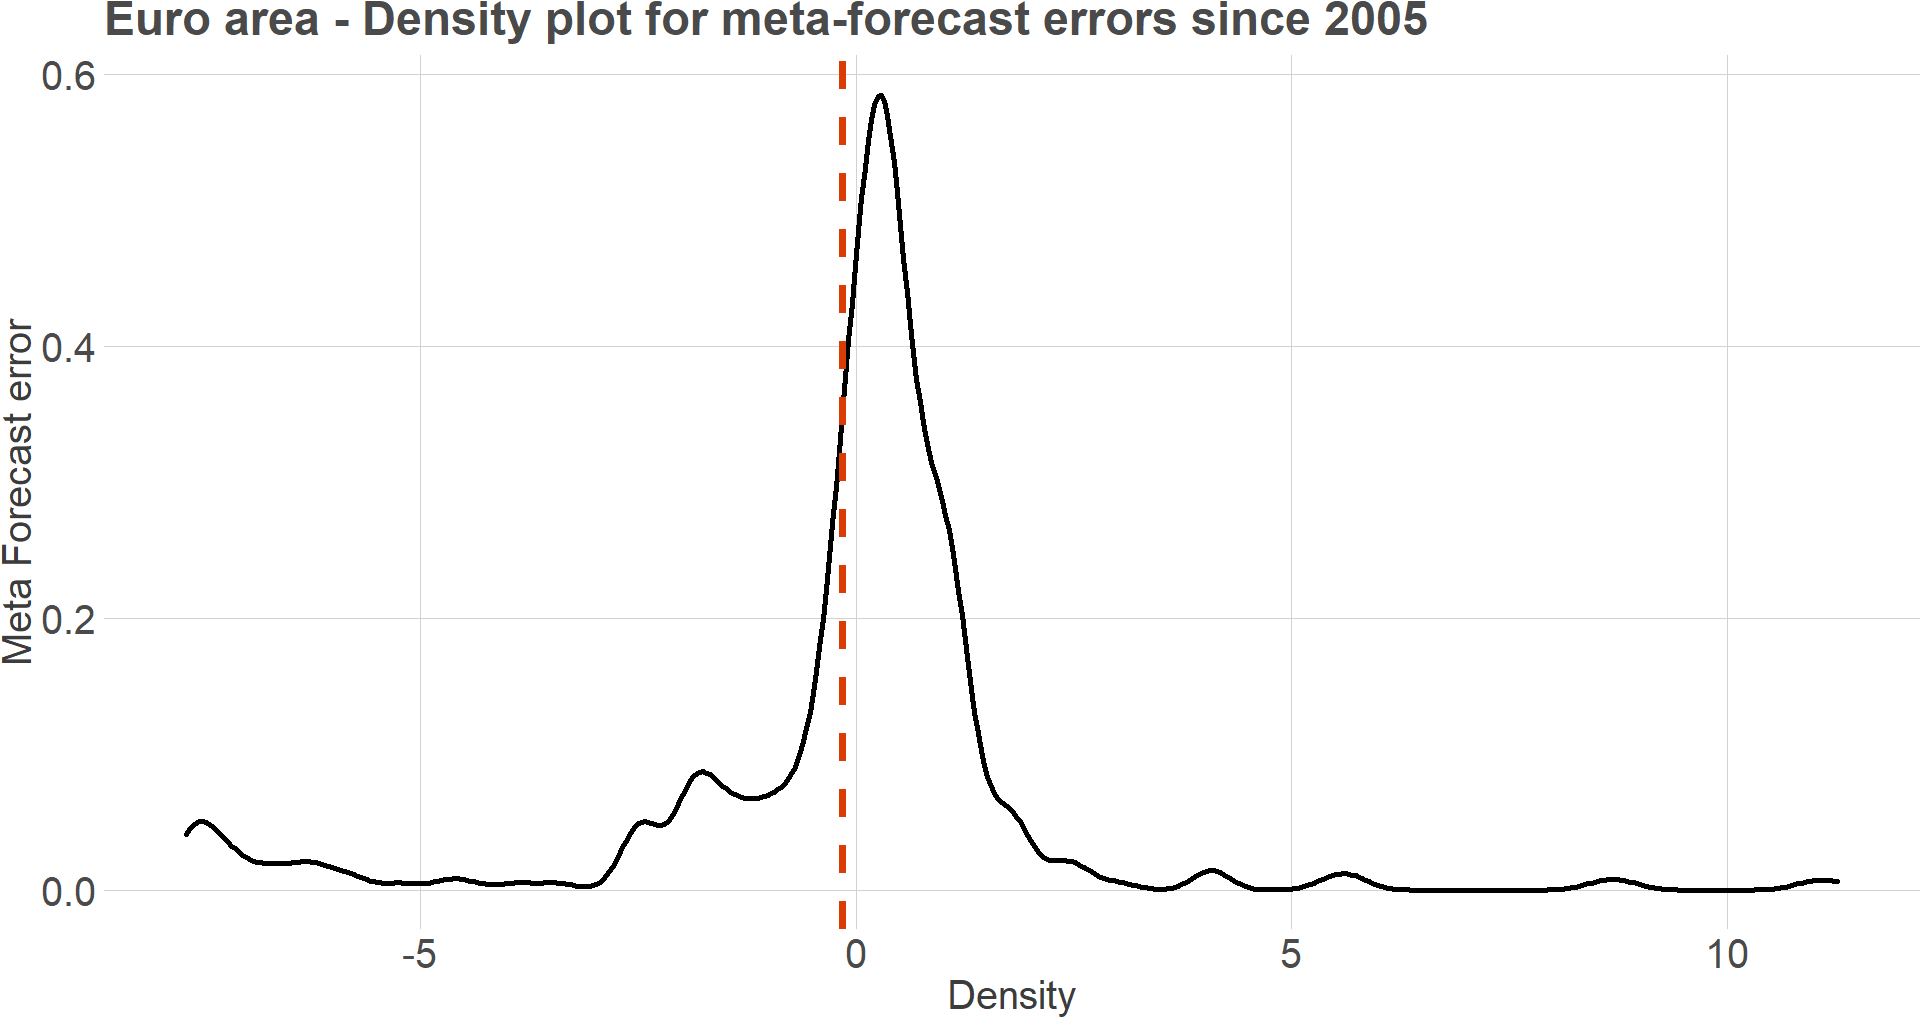
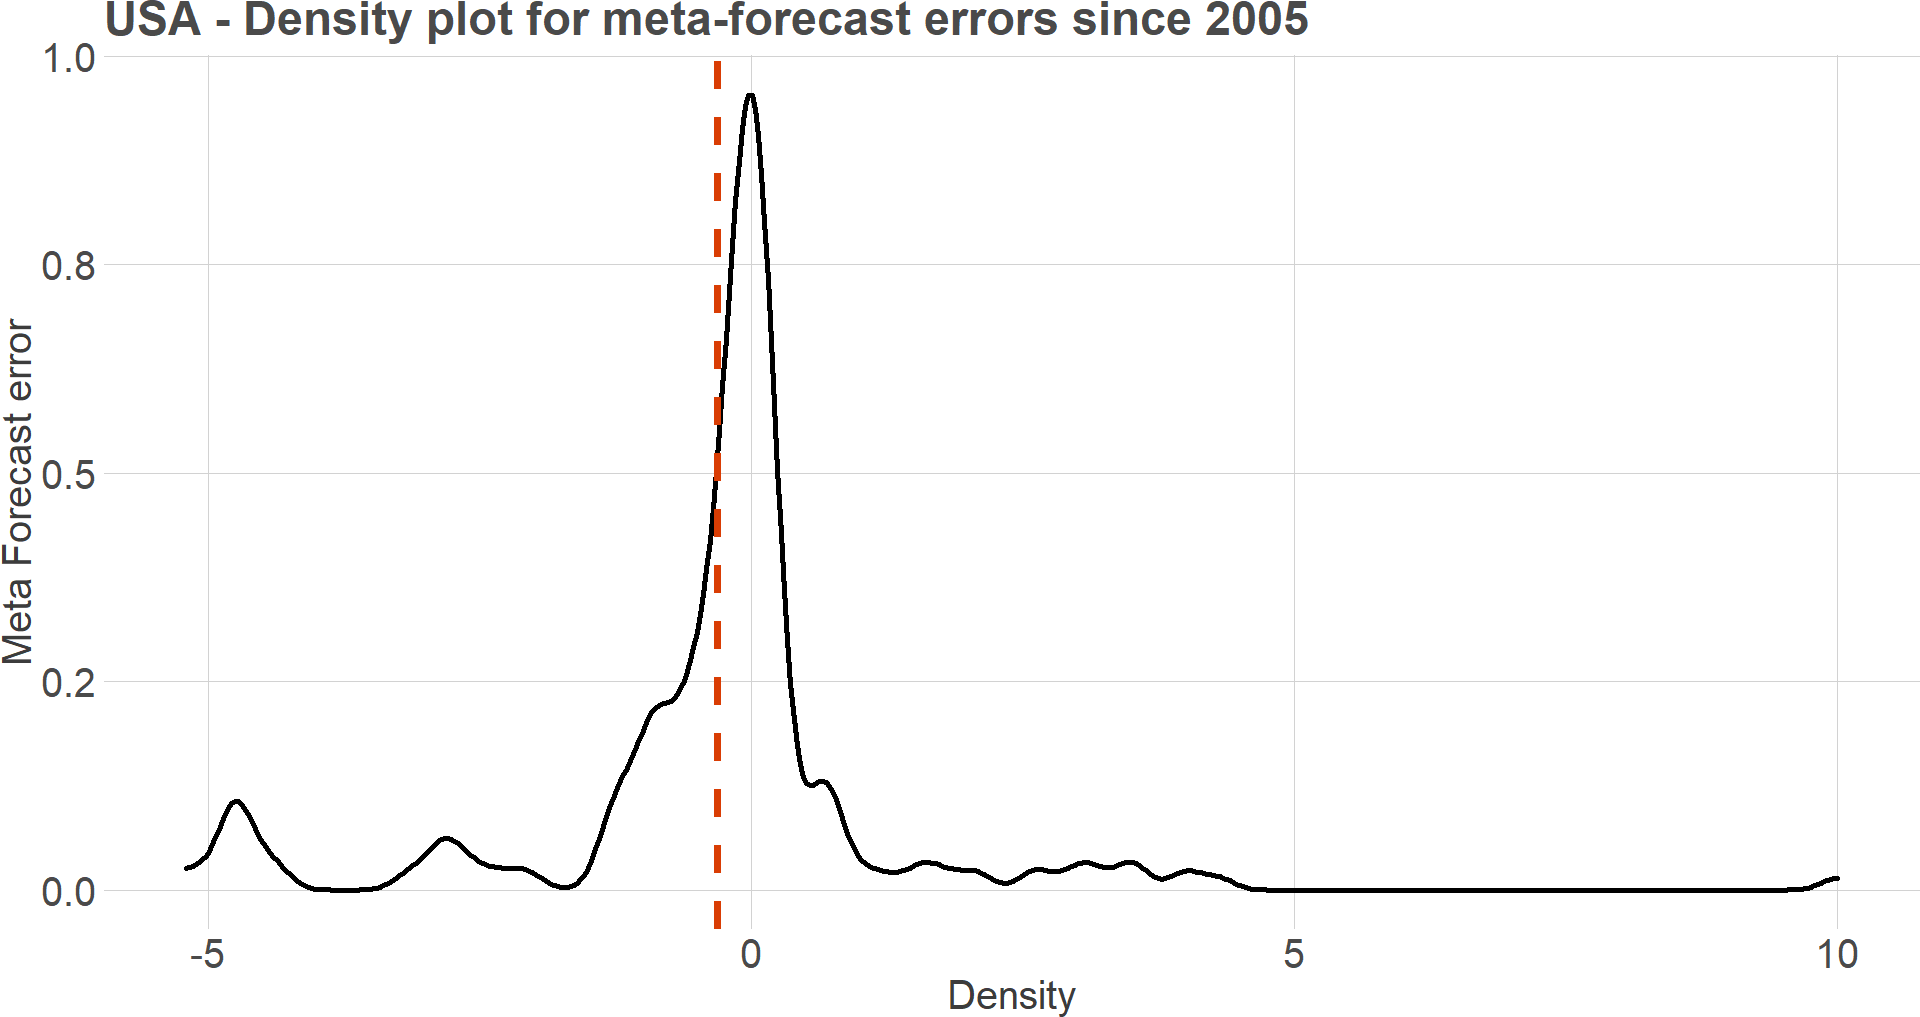
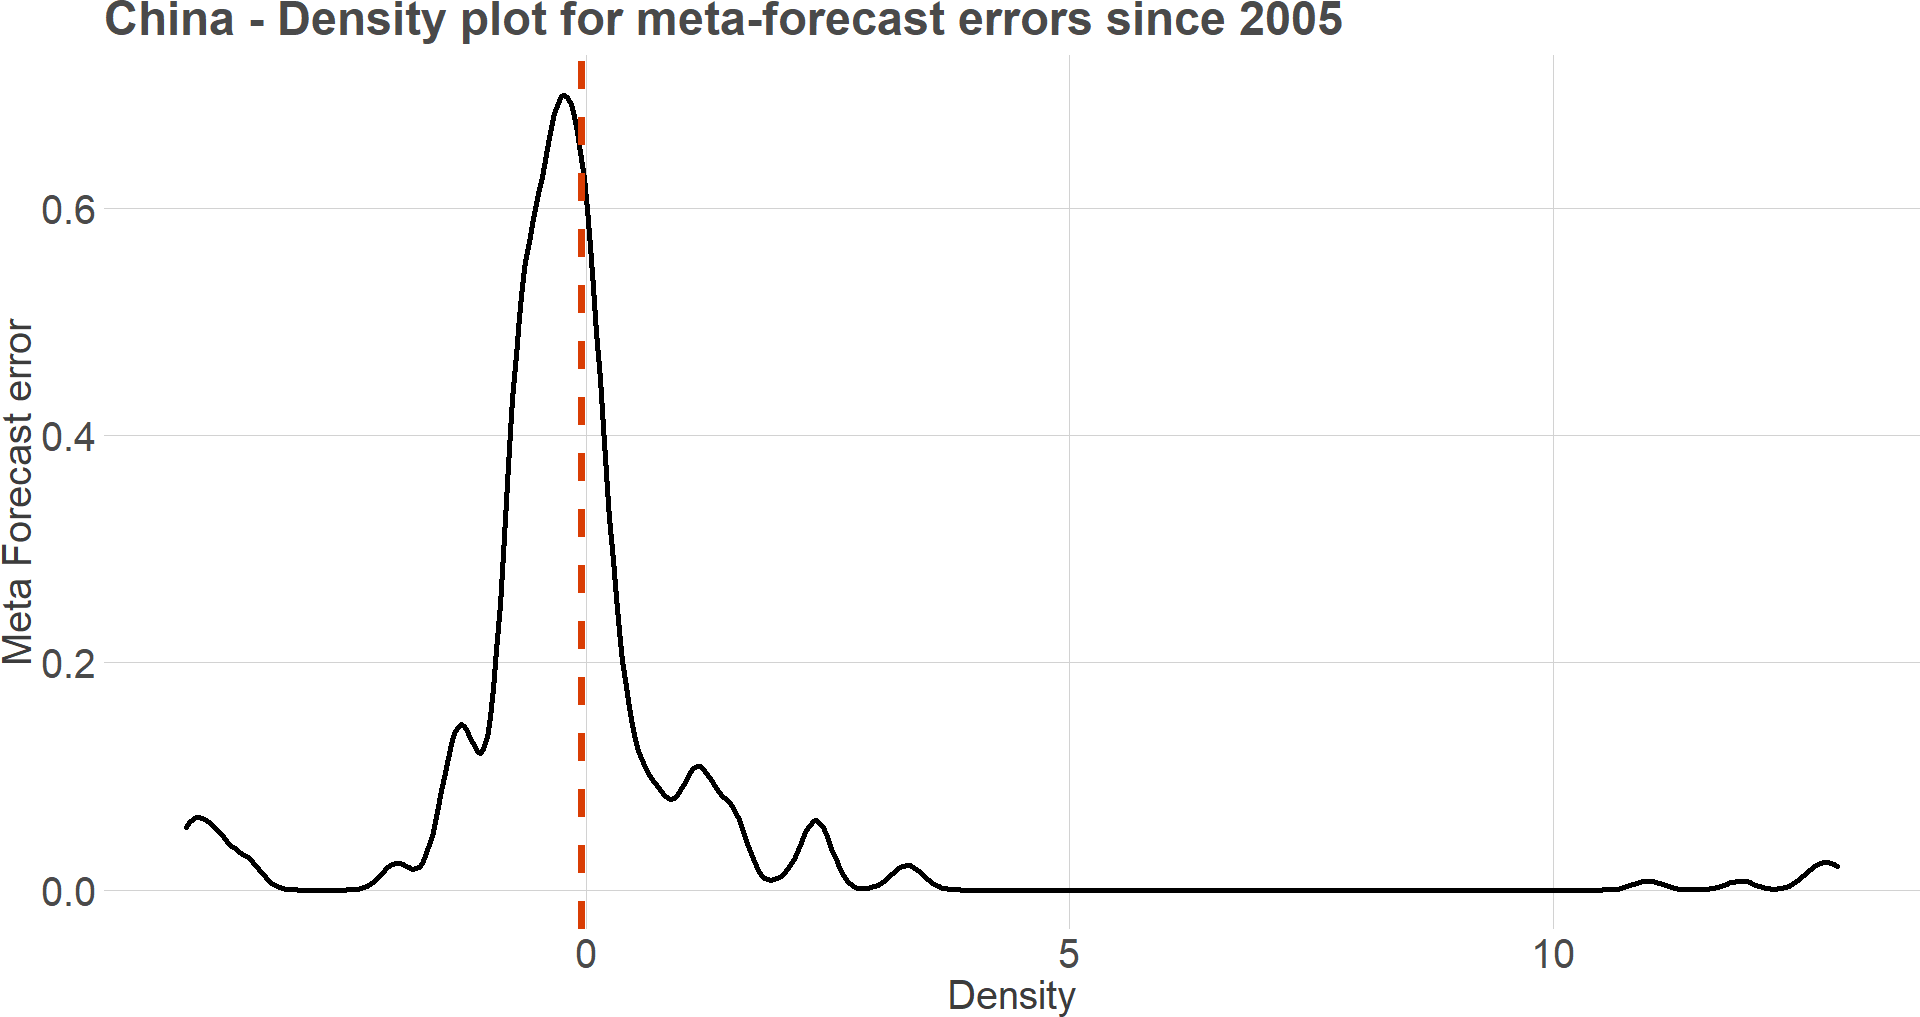
The forecasting errors of the meta-forecast since 2005 are thus represented in the graphs below for each area. Overall, our meta-forecast has a very slight optimistic bias for the Euro area and the United States. The errors are highly concentrated around 0.
The few error outliers reflect major macroeconomic shocks such as the Covid-19 pandemic or, to a lesser extent, the global financial crisis of 2007-8.
Visualizing uncertainty
As part of our uncertainty-focused approach, we are presenting a range of possible outcomes for the forecast, in addition to the point forecast in every monthly forecast report and for each area. One example of this kind of visualization is featured below; for each forecast, confidence intervals are represented, at the 90% level, 80% level and 70% level.
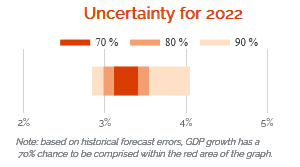
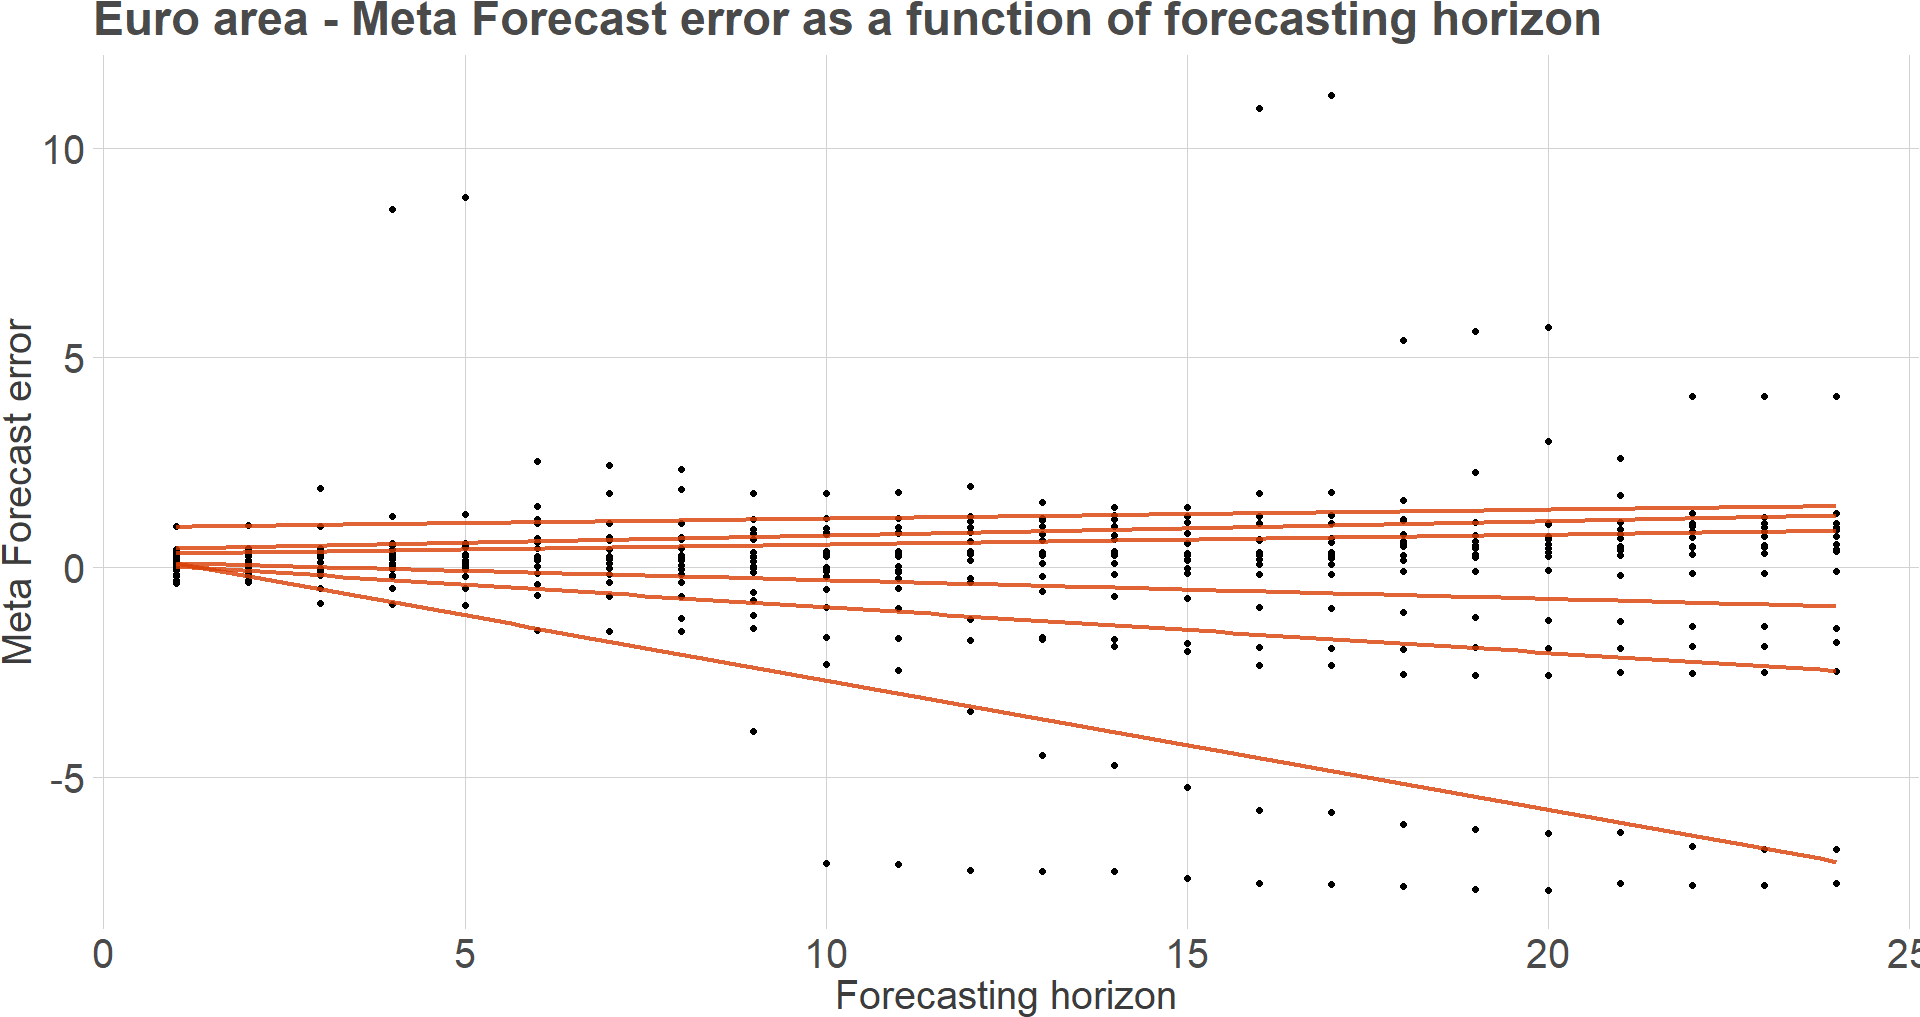
The uncertainty as expressed in the confidence intervals is estimated based on the historical errors of the meta-forecast going back as far 2005. The computed uncertainty also takes the horizon into account by means of a quantile regression. As can be expected, the further we are from the end of the year, the larger the uncertainty surrounding the forecast will be. An example of the result of the quantile regression we conducted is featured below for the euro area.
Bibliography
Armstrong, J.S. (2002) Principles of forecasting: A handbook for researchers and Practitioners. Boston, MA: Kluwer Academic Publishers.
Bates, J.M. and Granger, C.W. (1969) “The combination of forecasts,” Operational Research Quarterly, 20(4), p. 451. Available at: https://doi.org/10.2307/3008764.
Clemen, R.T. (1989) “Combining forecasts: A review and annotated bibliography,” International Journal of Forecasting, 5(4), pp. 559–583. Available at: https://doi.org/10.1016/0169-2070(89)90012-5.
Granger, C.W. and Ramanathan, R. (1984) “Improved methods of combining forecasts,” Journal of Forecasting, 3(2), pp. 197–204. Available at: https://doi.org/10.1002/for.3980030207.
Makridakis, S., Hibon, M. and Moser, C. (1979) “Accuracy of forecasting: An empirical investigation,” Journal of the Royal Statistical Society. Series A (General), 142(2), p. 97. Available at: https://doi.org/10.2307/2345077.
Smith, J. and Wallis, K.F. (2009) “A simple explanation of the forecast combination puzzle,” Oxford Bulletin of Economics and Statistics, 71(3), pp. 331–355. Available at: https://doi.org/10.1111/j.1468-0084.2008.00541.x.